 Skip to main content
Signature requirements for EO/IR seek to define how easily a vehicle, ship, aircraft, or spacecraft can be “acquired” or recognized as distinct from the background environment.
Effective Strategies for Signature Analysis
Signature requirements for EO/IR seek to define how easily a vehicle, ship, aircraft, or spacecraft can be “acquired” or recognized as distinct from the background environment. It is similar to defining a maximum signal-to-noise ratio for a given platform: the lower the signal, the less distinct it is from the noisy background imagery. Because the requirements for signature often dictate the maximum contrast relative to the background, leading OEMs contract with ThermoAnalytics to plan ahead for effective strategies to minimize or control signatures, leading to improved performance and what is often termed, “low observables” design. Furthermore, as the global leaders in EO/IR simulation and engineering, ThermoAnalytics can help optimize multiple factors in the overall requirements for a platform, such as achieving a weight requirement while simultaneously reducing EO signature with a low observables kit.
Expertise for World-Class Results
The requirements for EO/IR signature may, at first look, appear burdensome. But with ThermoAnalytics supporting your program, these factors can be rendered manageable through longstanding expertise and a simulation and testing workflow that yields world-class results. Our team has supported all major defense OEMs in NATO and can provide your organization with integrated design options to meet each requirement, in each electro-optic waveband from monochromatic visible, through near-IR, short wave IR, long-wave IR, far IR, and all the way out to millimeter wavelengths. This comprehensive span of EO/IR simulation is based on established and validated first principles physics, including atmospheric attenuation of source radiance out to the sensor using MODTRAN. Our physicists, engineers, and software developers provide an end-to-end solution to every requirement in your EO/IR profile.
Including:
- Source radiance reduction
- Thermal management and shielding
- Surface and paint modifications
- Nets, camouflage, and concealment
- Battery and engine thermal control
- Active cooling and water wash
Exceed Your EO/IR Requirements
Meet or exceed your EO/IR signature management requirements by partnering with our team at ThermoAnalytics, and rest assured that the most advanced team on the globe is in your corner. Briefings are available to qualified organizations. Contact us to review your requirements and discuss how best to reach them.
You Might Also Be Interested In:
Predicting Survival + Effectiveness
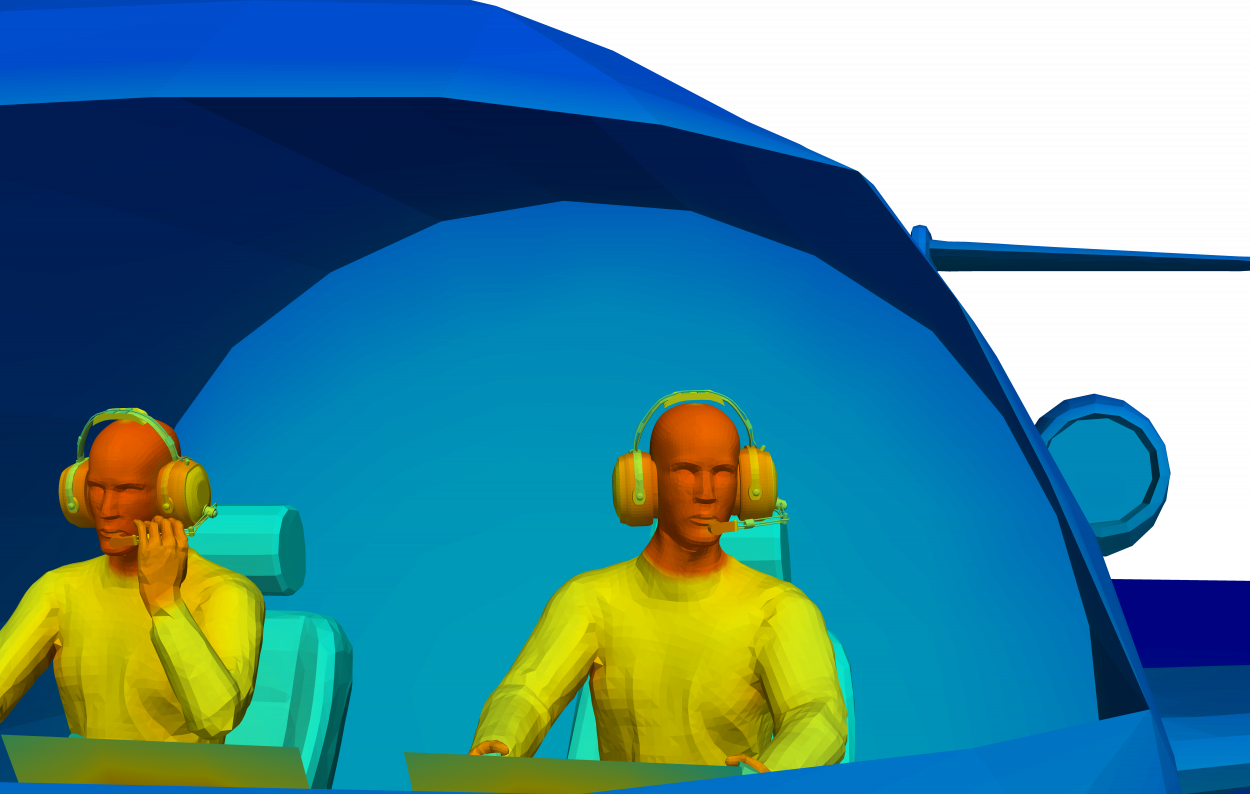
Predicting human thermal survival involves simulation across several distinct domains to be computed simultaneously – the environmental conditions over time, a detailed human physiology model that includes thermoregulation, and clothing models to capture both heat transfer and mass transfer resistance. Humans are thermally quite fragile and many critical biological processes are highly sensitive to temperature, including cognition. Thermal survival is limited to the study of how the body responds to dehydration, hypo- and hyperthermia, ignoring the situational effects of reduced cognitive capacity on the choices an individual makes when overheated or suffering from cold exposure.

Industry-Leading Signature Management
MuSES (Multi-Service Electro-Optic Signature) is an industry-leading signature management software that provides complete thermal modeling and infrared signature prediction capabilities. MuSES allows you to simulate any environment or condition and generate accurate EO/IR signature predictions. It provides many powerful features that allow you to model vehicles, aircraft plumes, ship wakes, humans, atmospheric effects, and much more.
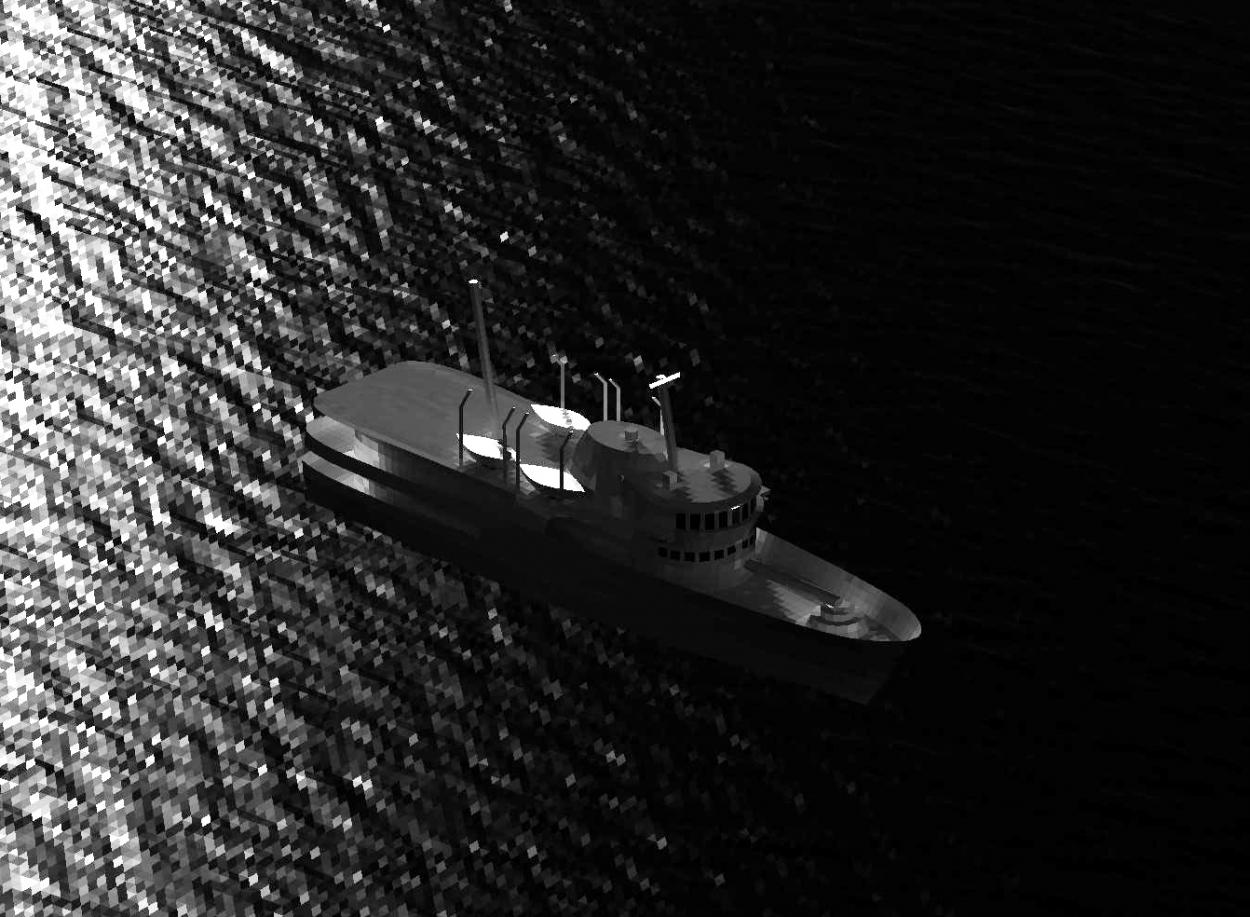
Adversary signature prediction
EO/IR image outlier detection is a process that enables persistent observation systems a reliable way to flag image frames that might show the presence of a target or collection of features. Image outlier algorithms are considered an established but evolving technology that benefits from large volumes of EO/IR imagery produced under known, or, better yet, controlled conditions. ThermoAnalytics’ combination of software developers, modeling experts and scientists collaborate to produce virtual datasets for training such deep learning outlier classifiers.
Getting Started
Let's Talk
If you would like to learn more about our Signature Management service and how it can provide you with an actionable design direction, reach out! We will demonstrate how our software will fit your specific requirements and help you understand what you will need to begin simulating your designs.
Support
We are here to answer your questions at every step. We support our customers before and after the sale, our commitment to you never changes.